|
|
||
|---|---|---|
| app | ||
| deploy | ||
| opencode | ||
| screenshots | ||
| static | ||
| templates | ||
| .env.example | ||
| .gitignore | ||
| .python-version | ||
| AGENTS.md | ||
| LICENSE | ||
| main.py | ||
| opencode_session_chart_flicker_2026-08-30.txt | ||
| opencode_session_journal_append_2026-08-30.txt | ||
| pyproject.toml | ||
| README.md | ||
| uv.lock | ||

dashboard
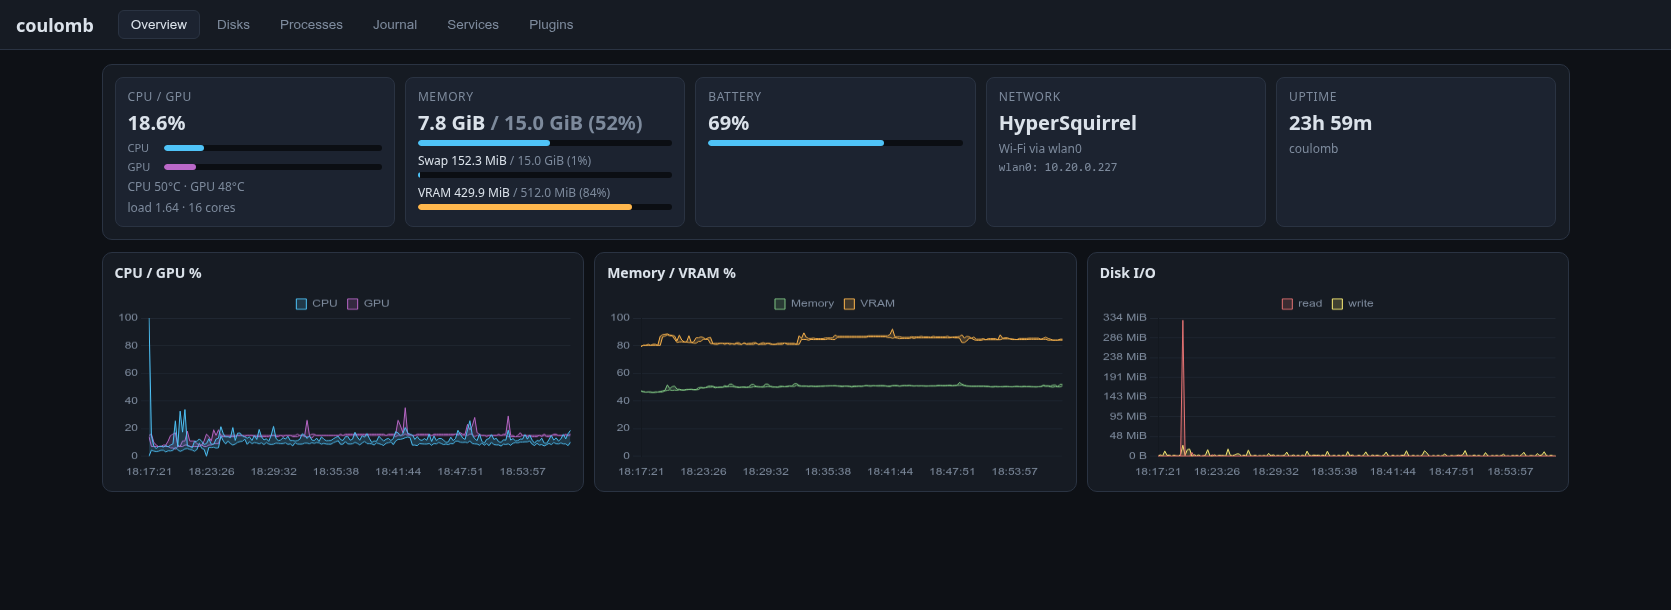
A single-host computer dashboard and combined task manager: live system metrics, disk IO, process explorer, journal tail, and a systemd unit manager — all in one browser page. Built with FastAPI (Python, managed by uv) and htmx + Chart.js on the front end (no build step, JS is vendored).
Screenshots
| Overview | Disks |
|---|---|
 |
 |
| Processes | Journal |
 |
 |
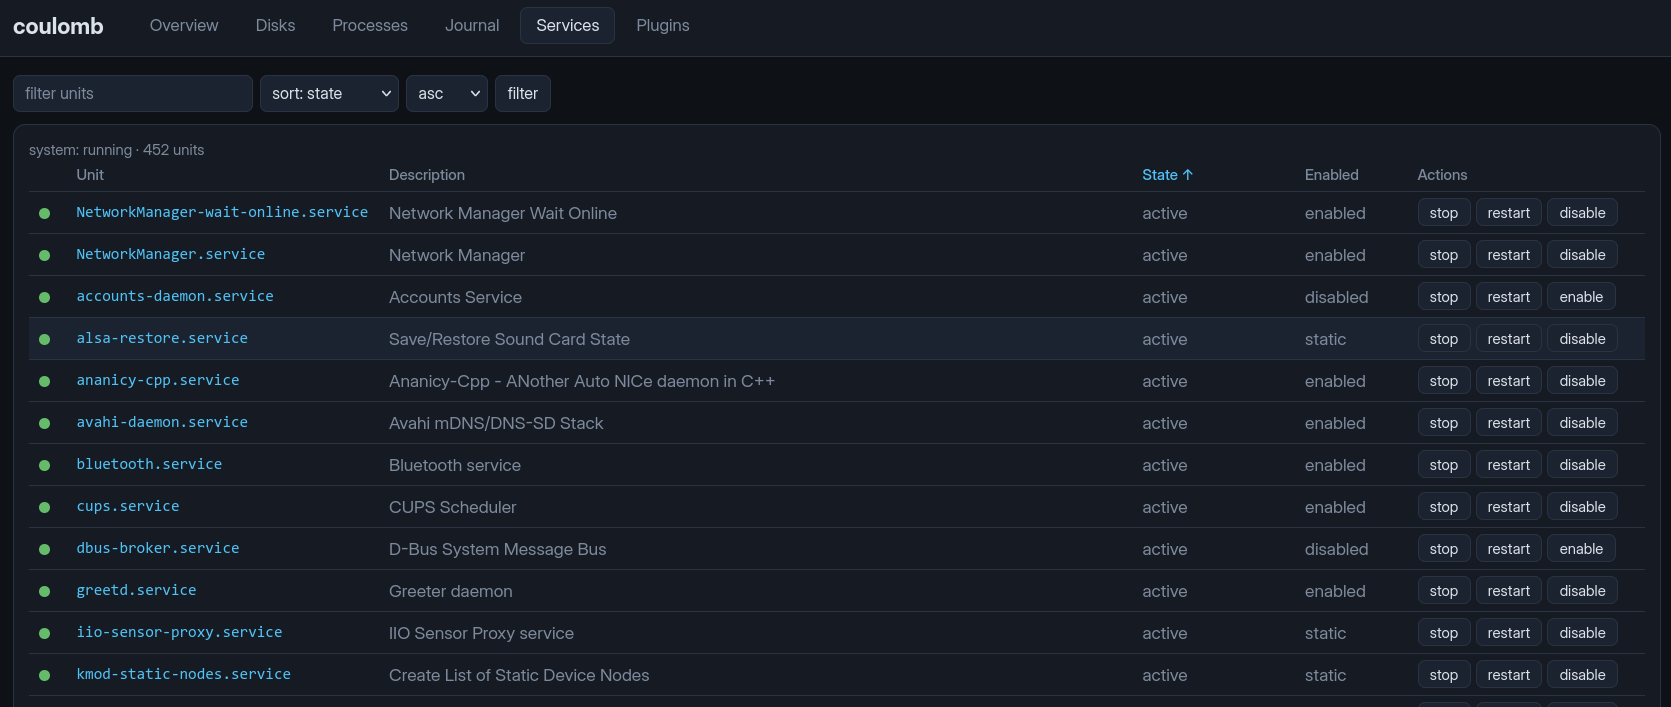
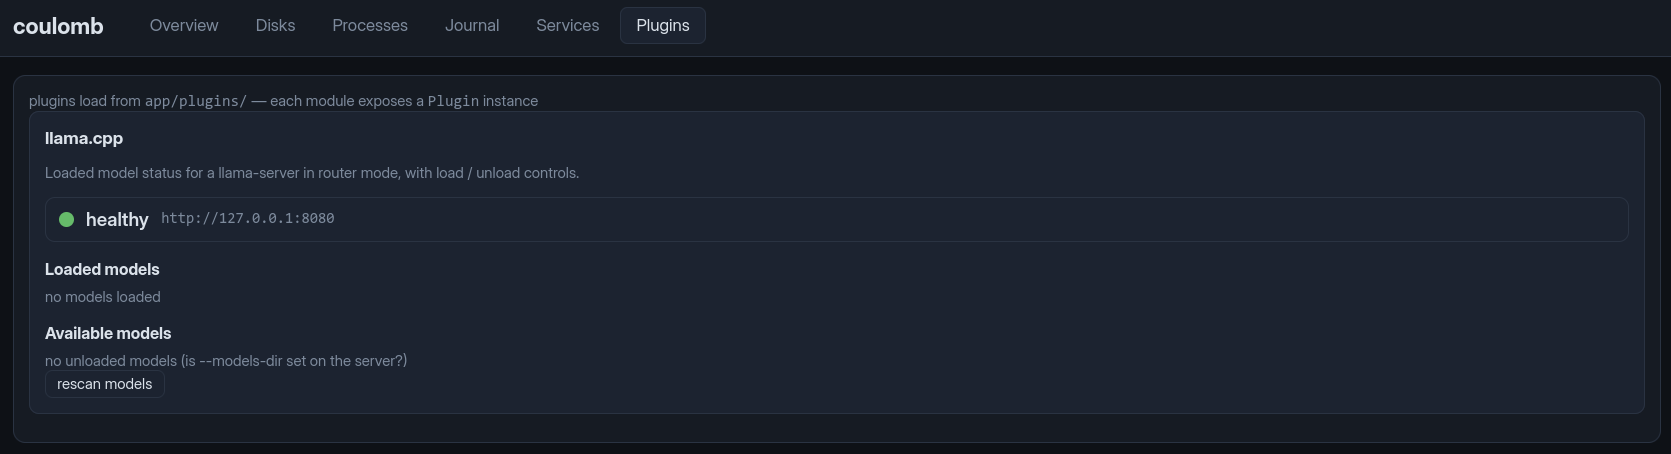
| Services | Plugins |
 |
 |
Authorship
This code was written by Qwen3.8-27B (an LLM) and corrected by Johannes Schriewer hallo@dunkelstern.de.
If you want to see the OpenCode transcripts see the opencode sub-directory.
I will include all transcripts when changing the software there.
⚠️ Security
This app has no authentication and no TLS. It binds to 127.0.0.1 by
default and is meant to be used from the machine itself. To use it remotely,
tunnel it — e.g. ssh -L 8501:127.0.0.1:8501 user@host and open
http://127.0.0.1:8501 — or serve it through your own authenticated reverse
proxy / VPN. Do not point DASH_HOST at a public interface without adding
authentication yourself.
The Services tab can start/stop/enable/disable systemd units; any user who can
reach the dashboard can do that (the app uses sudo for privileged actions,
so the dashboard user needs sudo rights for systemctl).
Quick start
Requirements: Python ≥ 3.12 and uv. On Linux (it is tested on Arch).
uv sync
uv run python main.py
Then open http://127.0.0.1:8501.
Configuration
All settings are environment variables with the DASH_ prefix; a .env file
in the project root is read automatically (see .env.example).
| Variable | Default | Meaning |
|---|---|---|
DASH_HOST |
127.0.0.1 |
Bind address |
DASH_PORT |
8501 |
Port |
DASH_SAMPLE_INTERVAL |
2.0 |
Seconds between samples |
DASH_RETENTION_MINUTES |
60 |
In-memory history window (lost on restart) |
DASH_LLAMA_BASE_URL |
http://127.0.0.1:8080 |
llama-server (router mode) base URL |
DASH_LLAMA_API_KEY |
(empty) | Set if llama-server runs with --api-key |
DASH_LLAMA_TIMEOUT |
4.0 |
Seconds for llama-server requests |
Tabs
- Overview — CPU + GPU (utilisation, CPU temperature, VRAM, GPU temperature
when exposed by sysfs/hwmon), RAM + Swap + VRAM, active Wi-Fi connection
(SSID via
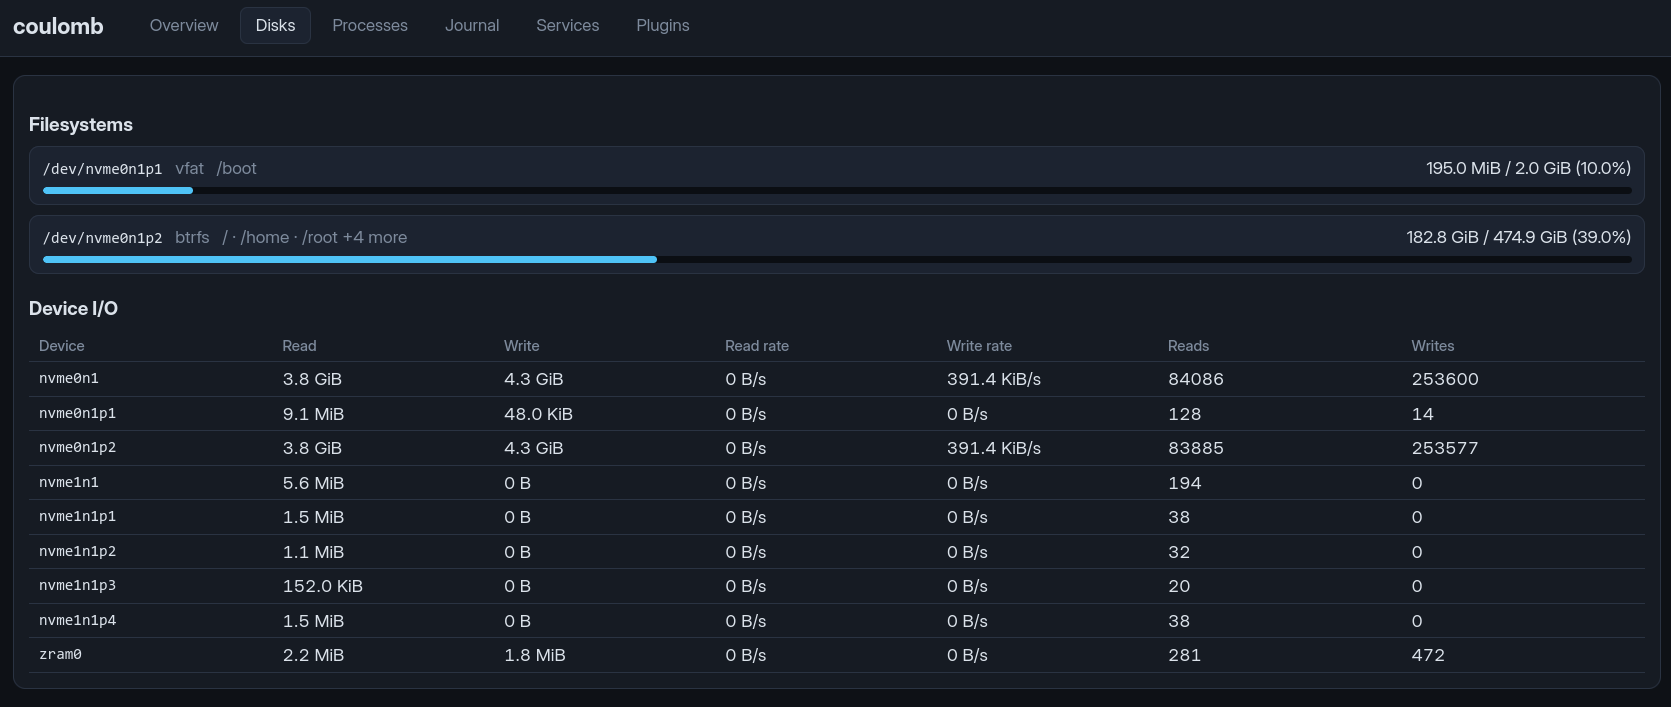
iw) and IP addresses of all up interfaces. History charts (CPU/GPU, memory/VRAM, disk I/O) are in-memory, sampled everyDASH_SAMPLE_INTERVALforDASH_RETENTION_MINUTES. - Disks — partitions with size/use and per-device read/write rates.
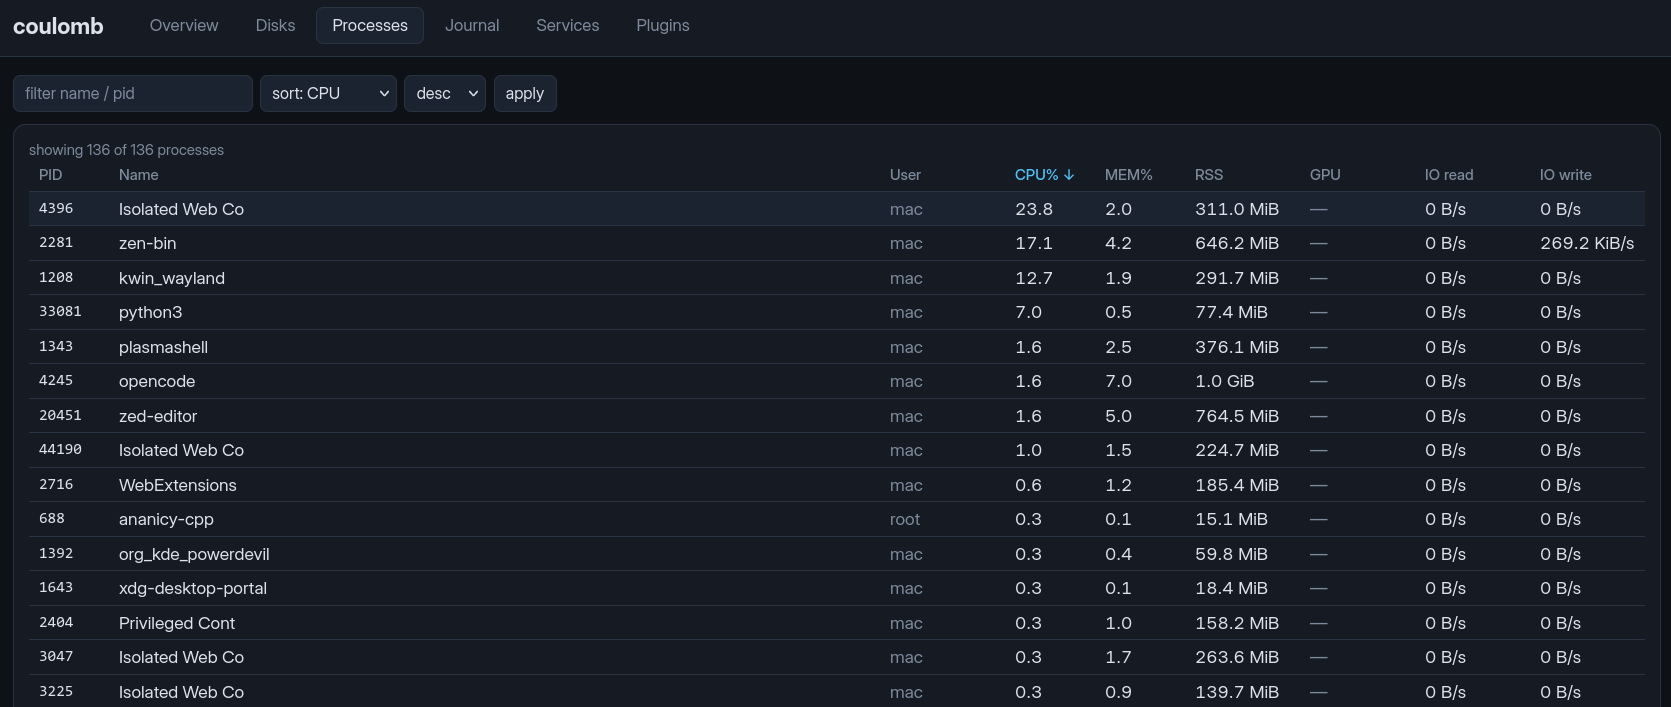
- Processes — live table, filterable and sortable by CPU, memory, RSS, GPU and IO columns.
- Journal — streaming
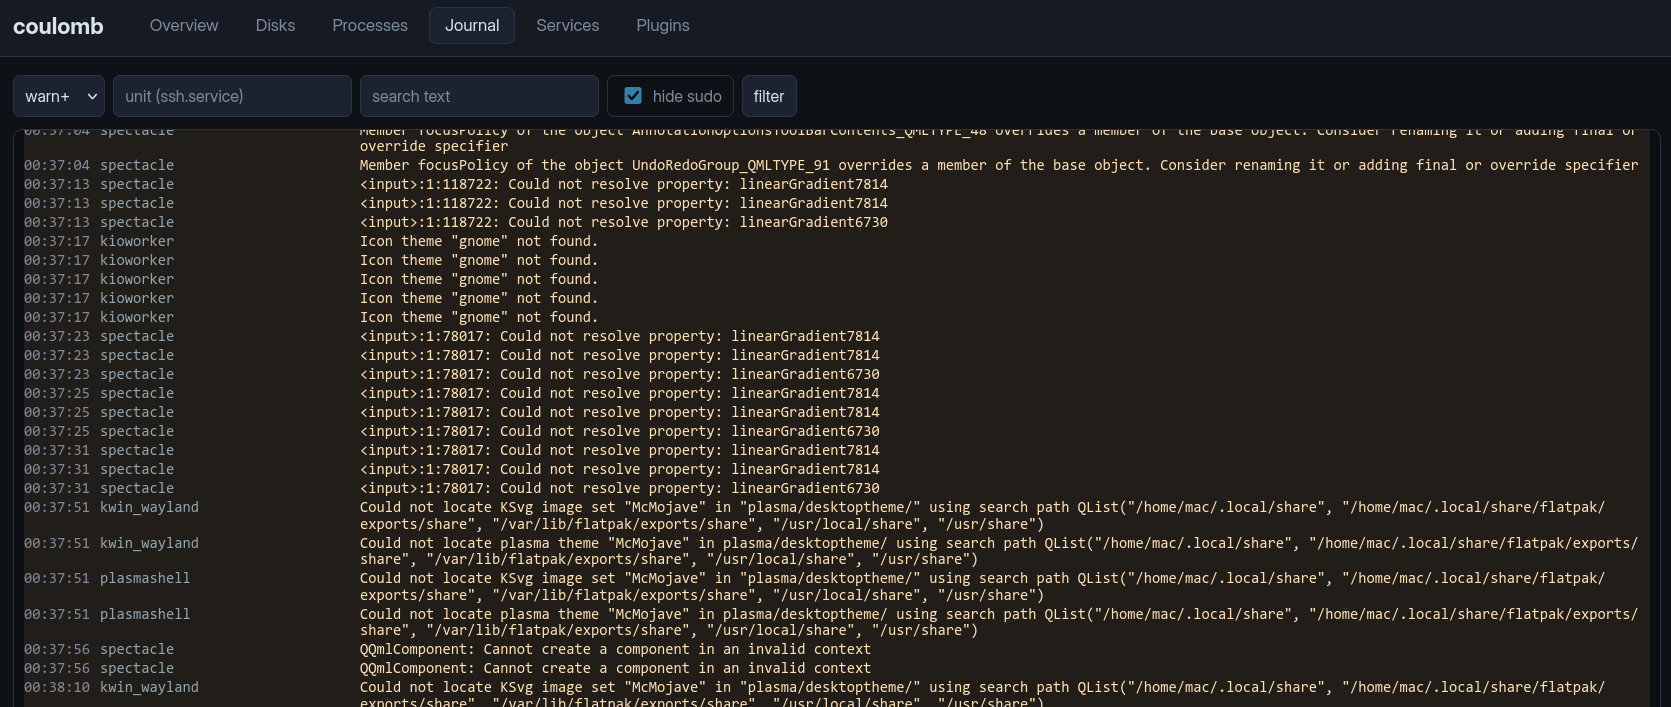
journalctltail with level filter, unit filter, free-text search and a "hide sudo" toggle (on by default, since the dashboard's ownsudo systemctl/journalctlcalls otherwise log noise). Uses journal cursors, so filtering does not re-dump history. - Services — all systemd service units with state and enabled-ness,
sortable by name, state and enabled-ness; click a
name for details (main PID, start time, restarts, recent journal lines) and
run
start/stop/restart/enable/disableactions. - Plugins — currently llama.cpp: model status, load/unload buttons and
a rescan for a
llama-serverrunning in router mode.
llama.cpp router mode
The plugin talks to a llama-server started with a models directory (router
mode), which exposes the native /models, /models/load and /models/unload
endpoints:
llama-server --models-dir /path/to/your/models --host 127.0.0.1 --port 8080
The plugin polls GET /health and GET /models, posts {"model": id} to
/models/load and /models/unload, and rescans with GET /models?reload=1.
If the server is down the plugin shows unreachable and the rest of the
dashboard keeps working.
Running as a systemd service
A ready-made unit is in deploy/dashboard.service:
You have to edit that file to point to the checkout of the tool and change the user and group!
cp deploy/dashboard.service /etc/systemd/system/dashboard.service
# adjust User= and paths if needed
uv sync   # once, after changing dependencies
systemctl daemon-reload
systemctl enable --now dashboard
journalctl -u dashboard -f
Project layout
main.py               # uvicorn entry point
app/
  config.py           # pydantic-settings (DASH_* env)
  main.py             # app factory, lifespan sampler
  sampling.py         # background sampler task
  state.py            # in-memory ring buffers
  collect/            # cpu / mem / gpu / disks / procs / net collectors (psutil + sysfs)
  systemd/units.py    # unit list / detail / whitelisted actions (sudo fallback)
  journal.py          # journalctl -o export parser + cursors
  render.py           # jinja env + filters
  routers/            # overview / disks / processes / journal / services / plugins
  plugins/            # base.Plugin + llamacpp plugin
templates/            # htmx fragments
static/               # css, js, vendored htmx + chart.js
deploy/               # dashboard.service
Adding a plugin: create a module in app/plugins/ defining a Plugin
instance (id, title, poll interval, fragment function) and register it in
app/plugins/__init__.py.
License
The Unlicense — public domain dedication, no conditions.